
Upload a Paper and Place Its Data Charts into a PPT
Extract existing paper charts and generate supplementary explanatory visuals where no figure exists. Verify data, axes, units, and captions after export.
Each chart supports the slide conclusion
Clear, consistent charts
Extract original figures and generate supplementary comparison visuals when needed.
No plotting skills needed
No Excel, Origin, or GraphPad experience is required.
Data matched to slides
Pair result slides with data figures and method slides with explanatory visuals.
Editable PPTX
Export a standard PPTX and continue refining it.
What a Data-Chart Slide Should Include
Data figures from the paper
Place them on the relevant slide and verify data and captions.
Comparison and trend charts
Visualize key data as a readable chart.
Tables
Lay out structured tables on the corresponding slide.
Caption and explanation
Keep the figure and its explanation together.
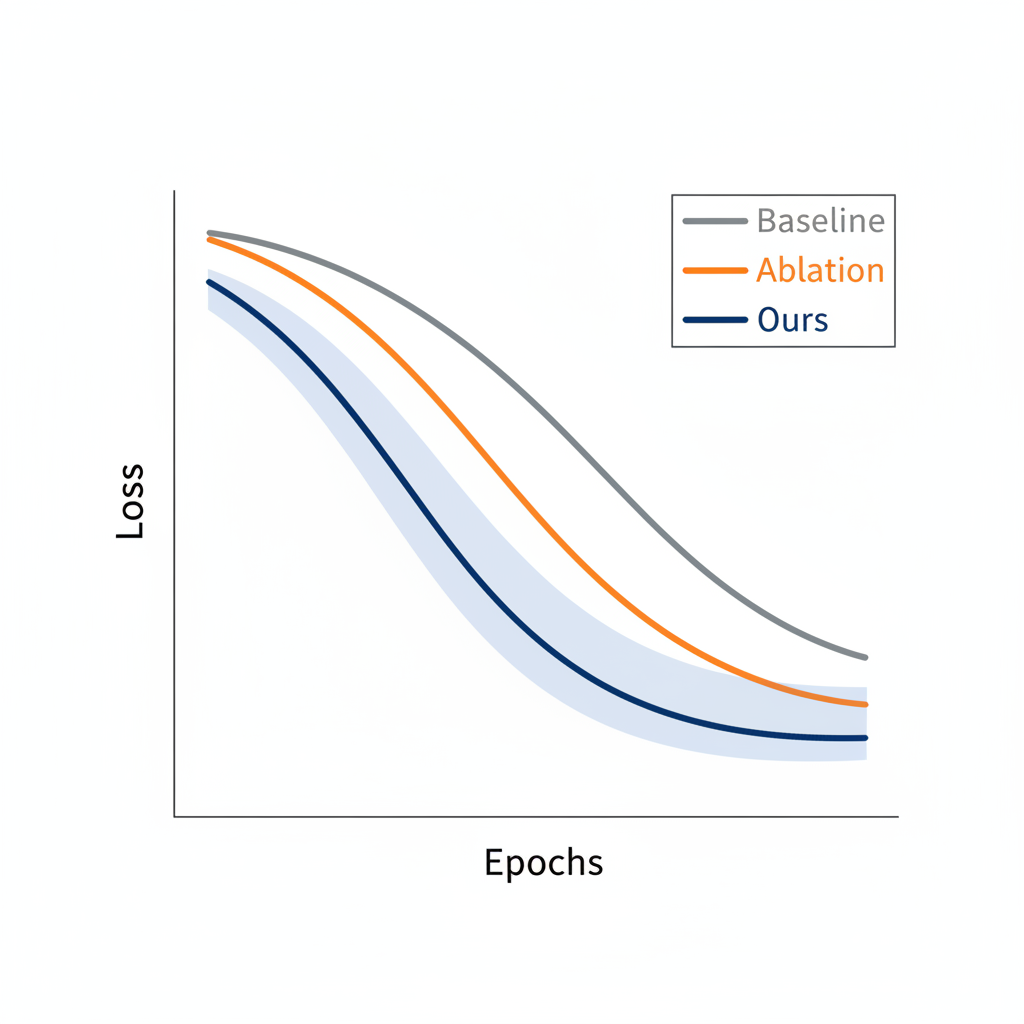
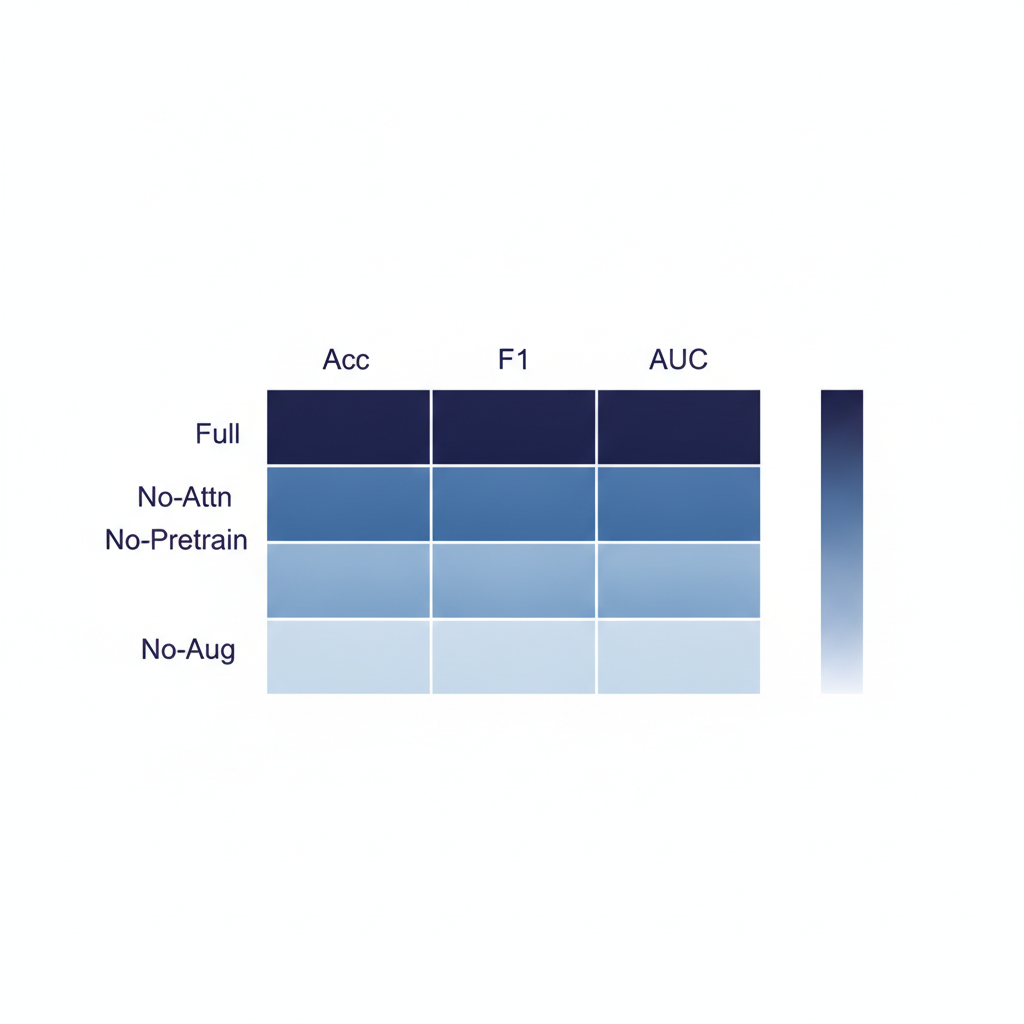
Data Chart Examples
These examples use English labels. Actual content and language follow the paper.
Create an Editable Draft in Three Steps
Upload paper PDFs
Drag in one or more papers.
Generate data charts
Place source figures and generate supplementary explanatory visuals.
Review and export
Verify data, axes, and captions, then export an editable PPTX.
Frequently Asked Questions
Can I include charts without using plotting software?
Yes. Existing paper figures are extracted for relevant slides. Verify any supplementary visual against the paper's data after export.
Are generated charts clear?
Original figures are extracted from the source. Supplementary visuals can be adjusted in the exported PPTX.
Will they match my paper's data?
Source figures come directly from the paper. Values in generated supplementary visuals still require verification against the source text.
Which format is exported?
A standard editable PPTX file.
Skip Manual Chart Design
Upload a paper and generate data charts in an editable PPT draft.