
Upload a Paper and Generate Research Figures in Your Slides
Create schematics, mechanism diagrams, and conceptual figures without learning AI drawing or Photoshop. The image model uses your paper and places each figure on the relevant slide.
Verify arrows, labels, and terminology
Professional scientific visuals
Generate schematics and mechanism diagrams suited to an academic context.
No drawing experience needed
Upload your paper without learning illustration software or AI drawing.
Figures match the text
Place each visual on the slide it explains instead of using unrelated decoration.
Editable PPTX
Export a standard PPTX and continue refining it.
What a Research-Figure Slide Should Include
Schematic / conceptual figure
Turn abstract concepts into an intuitive visual.
Mechanism / principle diagram
Visualize a process and its mechanism.
Explanatory slide visual
Use a relevant image to explain the slide's central content.
Supporting explanation
Lay out the figure and explanatory text together.
Research Figure Examples
These examples use English labels. Generated content and language follow your own paper.
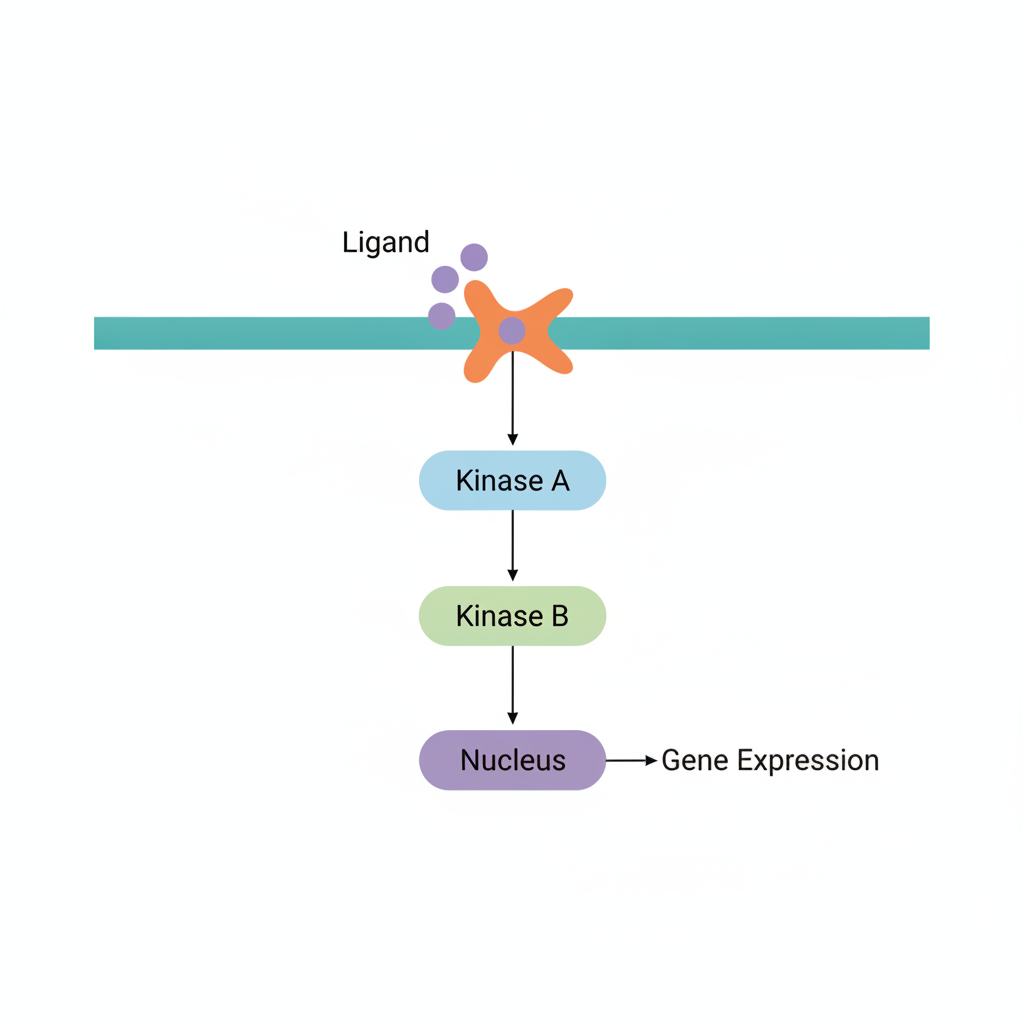
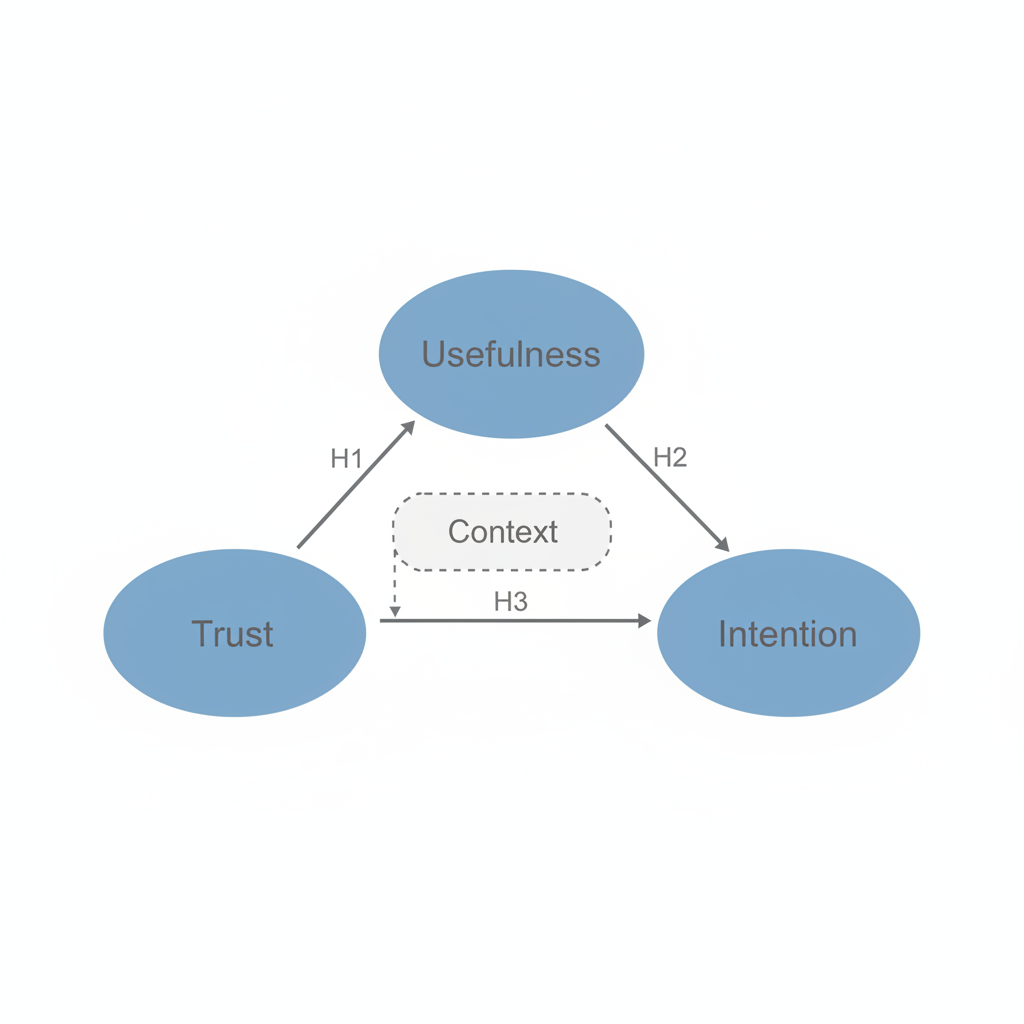
Create an Editable Draft in Three Steps
Upload paper PDFs
Drag in one or more papers.
Generate research figures
The image model turns the content into clear, structured slides.
Review and export
Verify relationships, labels, and terminology, then export an editable PPTX.
Meet Resolution Requirements Before Submitting a Figure
Projectors are forgiving, but journals are stricter. A figure made to publication standards usually works for both. Elsevier artwork guidelines
| Image type | Minimum resolution |
|---|---|
| Photographs / micrographs (halftone) | At least 300 dpi. |
| Pure line art | 1000 dpi; vector formats such as EPS, PDF, or SVG avoid raster-resolution limits. |
| Mixed line and image content (combination) | 500 dpi. A chart with text labels belongs in this category. |
Practical conclusion: use vector formats for schematics and mechanism diagrams whenever possible. They remain sharp when enlarged and allow text edits without redrawing. A low-resolution raster image cannot be repaired by enlarging it later.
Frequently Asked Questions
Can I get research figures without drawing skills?
Yes. Upload the paper to generate research figures, then verify scientific relationships, labels, and terminology.
Can the figure drift away from the topic?
Figures are generated around the paper's content and placed on the corresponding slide.
Is the visual style consistent?
The academic style is kept consistent with the selected presentation scenario.
Which format is exported?
A standard editable PPTX file.
Skip Manual Figure Design
Upload your paper and generate research figures in an editable PPT draft.