Upload a Research Plan and Generate a Project Timeline
Turn a research plan into a Gantt chart for your proposal presentation. Review every task, date, and dependency before submission.
See the schedule at a glance
Turn research stages and dates into a clear Gantt chart.
No specialist software
Upload your plan without learning Project or Excel.
Fits the proposal deck
Place the chart on the research-plan slide in a consistent deck.
Editable PPTX
Export a standard PPTX and adjust the dates afterward.
What a Research Gantt Chart Slide Should Include
Research schedule
Map stage tasks to a visible timeline.
Stage milestones
Mark important, verifiable checkpoints.
Task breakdown
List the work clearly by research stage.
Supporting explanation
Add concise text explaining the chart.
Gantt Chart Examples
These examples use English labels. Generated content and language follow your own paper.
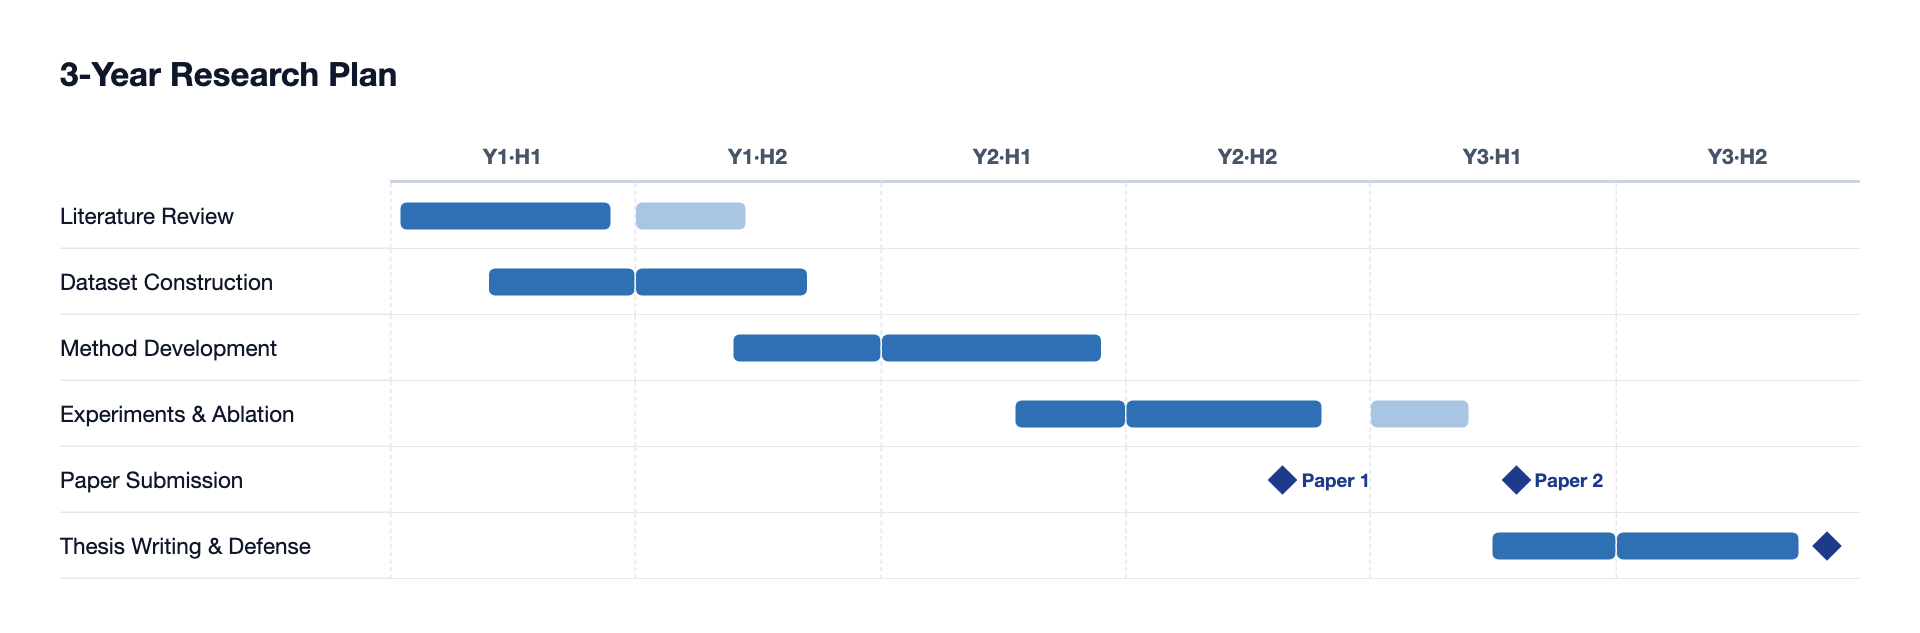
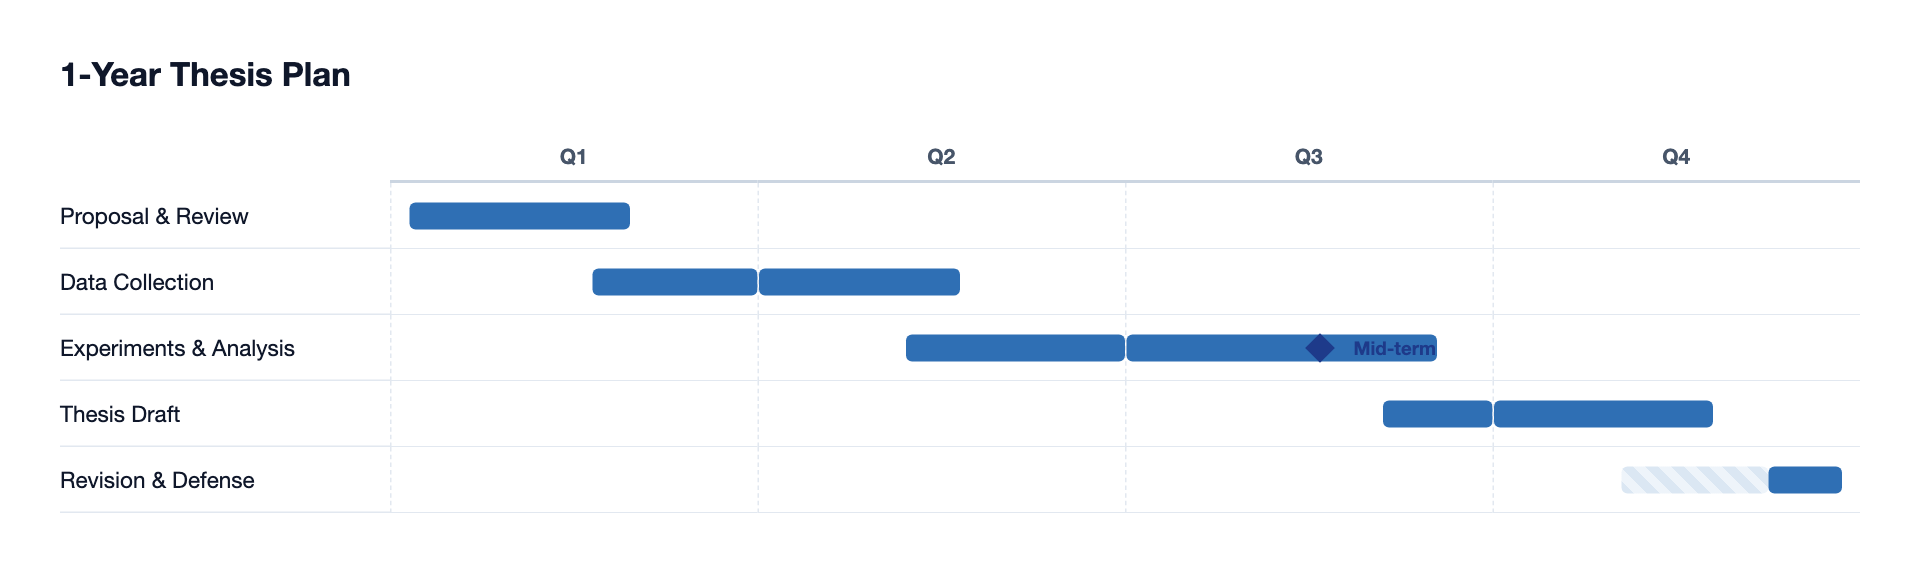
Create an Editable Draft in Three Steps
Upload the research plan
Drag in a proposal or research-plan PDF.
Generate the Gantt chart
The image model turns the schedule into a clear chart slide.
Review and export
Check tasks, dates, and dependencies, then export an editable PPTX.
Do Not Draw a Research Gantt Chart Like Project-Management Software
The reader is a reviewer, not a project manager. The chart must make feasibility immediately visible.
| Common mistake | How to fix it |
|---|---|
| Scheduling every task to the day | Use monthly or two-week intervals. Day-level precision in a three-year plan makes the schedule look implausible. |
| Calling “Stage 1 complete” a milestone | Name a deliverable: data collection completed, first draft submitted, or midterm review passed. A milestone must be verifiable. |
| Filling the entire timeline | Reserve uninterrupted time for writing and buffers for review and revision. A fully packed chart implies that one delay breaks the whole plan. |
| Using more than ten rows | Combine work into 6–10 stage-level tasks and keep details in the proposal text. More rows make priorities harder to see. |
Frequently Asked Questions
How is a research-plan Gantt chart different from a project Gantt chart?
A project chart tracks people and resources. A research chart demonstrates feasibility to reviewers. They mainly inspect each stage's output and whether the timeline has enough margin.
Can I generate one if I cannot make Gantt charts?
Yes. Upload the research plan to generate a chart, then verify the tasks, dates, and dependencies.
Can I change the schedule?
Yes. Export an editable PPTX and adjust it afterward.
Which format is exported?
A standard editable PPTX file.
Skip Manual Gantt Chart Design
Upload the research plan and generate a Gantt chart in an editable PPT draft.